The purpose of this site is not to enable individuals to scrutinize their neighbors but to provide information and comparisons to ensure Clarion County acts in the best interests of its taxpayers. To focus on property values rather than individuals, we have removed names from the data obtained through the Right-to-Know process. Our goal is to highlight apparent issues with Clarion County's approach to tax appraisals.
We wanted to provide an update on the status of our Right-to-Know (RTK) request for commercial assessment information. On January 28th, we requested the same data for commercial properties that we previously received for residential ones. This request was denied, with the county claiming they "do not possess that information." After further investigation, it became clear that they simply do not want to provide it. During the RTK process for residential properties, the county obtained the data from Vision to fulfill our request, but now it seems they are refusing to do the same for commercial properties.
The county is likely avoiding transparency regarding the reassessment process. They even requested a 30-day extension, which is typical, but in the final hours of that window, they responded in a way that left us little time to react. Ultimately, the Office of Open Records ruled that since the county doesn’t physically possess the commercial records, they weren’t obligated to request them. While the commissioner said to let them know if we needed anything, they did nothing to assist taxpayers in obtaining the information.
We filed an appeal with the Office of Open Records in Harrisburg, but the county involved their solicitor to block our access to the information. It’s unfortunate that taxpayer dollars are being used to shield commercial interests rather than promote transparency. Instead of requesting the information from Vision, the county chose to protect Vision’s interest in keeping public records private.
We encourage you to reach out to the commissioners’ office to demand transparency and access to this critical information.
Without this data, we can only speculate. 78% of Clarion County residents are facing a tax increase amounting to $4 million. State law mandates that the revenue generated post-reassessment remains the same. Therefore, it’s reasonable to assume Vision lowered commercial property values by $4 million to offset the increase for residential properties. This is concerning, particularly because Vision is owned by *Rubicon Technology Partners, a major investment firm with **interests across the U.S., benefiting from low commercial tax rates. This lack of transparency raises serious concerns about the county commissioners' complicity in Vision’s secrecy.
Attached are the arguments from the appeal with The Office of Open Records.
There are a few key points to understand about the data maps. They are derived from a combination of reappraisal data and information obtained from the county’s GIS Parcel Viewer website.
(An interesting side note: Since we published our article on February 6th, “County Tax Burden by School District”, in which we mentioned extracting data from the county maps, the GIS Parcel Viewer website has been taken down. We’ll leave it at that—though we hope we don’t sound like conspiracy theorists.)
One major issue with the data is inaccuracies regarding the physical location of parcels. Many large farms, mineral exploration companies, and private camps have mailing addresses that differ from the actual parcel location. This location is commonly referred to as the Situs Address. However, neither the data obtained through our right-to-know request nor the data extracted from the Parcel Viewer website contain the correct situs addresses. As a result, some anomalies appear in the maps, where parcels seem to be located outside county lines. This occurs because, in the absence of a situs address, the plots are mapped to their mailing addresses instead. That said, the tab 1 labeled “Based on $ Change by District” accurately reflects the school district in which each property is physically located.
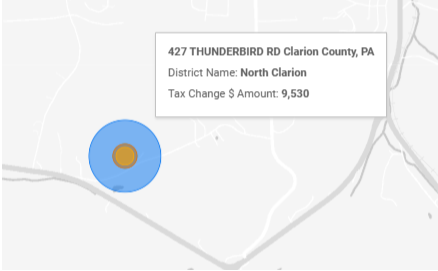
Both maps visualize data based on the actual dollar amount increase in parcel taxes rather than percentage increases. This approach better highlights the significance of the changes. In some cases, the bubbles or heat signatures represent multiple parcels owned by a single entity.
For example, one bubble represents a combination of parcels owned by the same entity, which experienced the following increases in county tax burden:
$9,530 in North Clarion SD
$930 in Clarion-Limestone SD
$1,950 in Clarion Area SD
These figures exclude school taxes. Their current county tax burden stands at $3,970 and will increase by $14,020, bringing the total county tax burden to $17,900. Keep in mind that this amount does not include additional tax burdens from school districts and other municipalities.
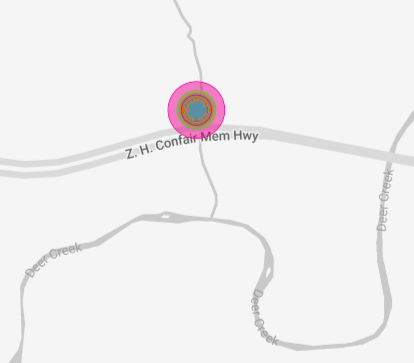
Another noteworthy anomaly is the large parcel situated between Williamsburg and Wentlings Corners near I-80 on Boyd Run. Several parcels appear at this location due to inaccuracies in the databases regarding parcel addresses. It is likely that these addresses fall outside the county lines and are based on mailing addresses rather than actual situs addresses.
Alas, the maps. Please reach out and let us know if you would like any additional views of this data. Contact Us Here
While we are awaiting the outcome of our appeal to the Office of Open Records regarding our latest RTK request for commercial data, we've been reviewing the residential data in the meantime.
It's important to clarify that this data does not pertain to school taxes. Instead, it reflects county tax revenue distributed by each school district. The dataset is a combination of information obtained through RTK requests and data extracted from the County Parcel Viewer (which you can explore to view property lines, similar to OnX Maps {Mysteriously, as of 7:40am 2/8/25, the county hosted map is offline. Thank goodness we already have the data}). We utilized this data to identify which school district each property belongs to.
The two main areas of interest are:
The percentage of residential properties versus the tax burden they experience.
The percentage change in tax burden for each district.
We want to extend our sincere apologies to those who attended Commissioner Braxton White’s Town Hall on April 8th based on our recommendation. Unfortunately, the event did not meet expectations.
Many of the questions presented were not centered on local issues and, more notably, appeared heavily scripted. While a few were thoughtful, the responses from Commissioner White were strikingly well-prepared—complete with pre-written quotes read directly from his phone. Although attendees were invited to submit questions upon arrival, we’re fairly certain none of the selected questions came from that evening’s submissions. This only reinforces the impression that the event was carefully orchestrated in advance.
If Commissioner White had no intention of answering questions spontaneously, a more honest approach would have been to solicit questions ahead of time and release a recorded response via social media. Instead, the public was misled into attending what turned out to be a performance rather than a genuine town hall.
Our intended question was:
“At the most recent Commissioners meeting I attended, the Commissioners indicated their willingness to support our efforts in monitoring the county-wide reassessment process. However, when we submitted a Right-to-Know (RTK) request to the county for the commercial appraisals, the request was denied on questionable grounds—that the county did not “physically have” the information. This is the same type of data that, as demonstrated with previous RTK requests for residential records, could have been obtained without difficulty.Rather than facilitating transparency, the county chose to have their solicitor represent Vision Solutions in the RTK appeal process. The full RTK request and the county solicitor’s responses are available on the www.TaxClarion.com website for public review.Given these circumstances, would you be willing to formally request this information directly from Vision Solutions tomorrow? Your action would go a long way toward keeping this process open and transparent, and would help the many concerned taxpayers better understand the impact of the reassessment.”
If Commissioner White—or any other commissioner—wishes to respond to this question, whether in writing or by recording, we’re more than willing to listen.
Again, we sincerely apologize to our supporters. We were misled—and unfortunately, so were you.
In Clarion County, Pennsylvania, the school district with the highest property tax rate is currently the Clarion Area School District, with a real estate tax rate of 65.73 mills. A mill represents $1 in taxes for every $1,000 of assessed property value. This means that for each $1,000 of assessed property value, homeowners in the Clarion Area School District pay $65.73 in school property taxes.
By comparison, the Redbank Valley School District's property tax rate is lower, at 46.84 mills. It's important to remember that property tax rates can differ within the county depending on the specific school district and municipality. Therefore, the total property tax rate for a property depends on its location within the county.
For the 2024-2025 school year, the millage rates for school districts in Clarion County, Pennsylvania, are as follows:
Clarion Area School District: 65.73 mills
Union School District: 60.8821 mills
Clarion-Limestone Area School District: 60.28 mills
Keystone School District: 58.587 mills
North Clarion County School District: 56.532 mills
Allegheny Clarion Valley: 51.67 mills
Redbank Valley School District: 46.84 mills
Karns City School District: 39.09 mills
A millage rate represents the amount of tax levied for each $1,000 of assessed property value. For example, a rate of 65.73 mills means that for every $1,000 in assessed property value, $65.73 is collected in school taxes.
Here's where the issue arises: If a home in the Clarion Area School District was assessed at $43,683 in 1975 but is now valued at $470,400, the school taxes would rise dramatically from $2,871.28 to $30,919.39 per year if you continue to use the current millage rate of 65.73. Clearly, such an increase is unsustainable, and the district would need to adjust the millage rate to reflect the new assessments. In this example, assuming no change in the county tax burden (meaning the county taxes remain the same despite the reassessment), the new school millage rate would be about 6.10 mills.
The formula for calculating millage rate is: Millage Rate = (Taxes / Assessed Value) × 1,000
With the majority of properties (78%, according to the provided calculations) facing an increase in county tax burden due to the new assessments, school taxes will also rise proportionally. In short, if you notice an increase in your tax burden, it's not just your county taxes going up—it may also affect your school and municipal taxes.
For more detailed information on the current millage rates, you can refer to the Clarion County Assessment Office's official documents.